Tag Archives: Building Automation System

Advancing Sustainability Through Innovation

A recent Ceres report analyzed 613 of the largest publicly traded corporations in the United States to reveal that while a growing contingent of companies are steadily building sustainability into their business operations, the vast majority are not. As detailed in the report, hundreds of companies are taking steps to reduce their green house gas emissions, but most have not set clear time line goals for these programs. Ceres’ corporate program vice president Andrea Moffat summarized the report by saying, “We’re seeing a change, but not fast enough and not to the extent that we think is really possible for US companies. We are not seeing the scale of change that we really need.”

The intention and action is there, but many corporations still struggle to advance the sustainability of their products and production methods. Many companies who make sustainability a priority have turned to eco-labels to provide third-party accreditation to validate their sustainability efforts. Yet, nearly all eco-labels focus solely on identifying performance within a specific product or service category and therefore cannot offer a holistic sustainability platform or incentive for continual improvement. Other problems with traditional eco-labels can lead consumers to question the true meaning of the label, for example when the certification is self-identifying.

Corporations need a neutral third party who can both provide a path forward for sustainable innovation, as well as ensure they are continuing to make substantial progress and improve their impact on the world. The Cradle to Cradle Certified Products program provides companies with a verified continuous improvement sustainability platform that addresses the five most crucial aspects of corporate sustainability: water use, energy consumption, material health, material reutilization and social fairness.

The program helps corporations choose safer alternatives for ingredients in their products and set clear goals and deadlines for the improvement of the five core areas moving forward.

To get on the path toward making safer products with the Cradle to Cradle Certified program:

1. Determine if your product is appropriate for certification.

–Does it comply with the banned chemicals lists?

–Is there a commitment to continuous improvement and product optimization?

2. Select an Accredited Assessment body for testing, analysis and evaluation of your product.

3. Compile initial application forms.

4. Work with you assessor to compile and evaluate data and documentation.

–Collect information on your supply chain.

–Work with assessor to develop optimization strategies.

–Submit a Certification Summary Report assembled by your assessor to the Institute for final review.

5. Receive Certification Summary Report Review: The Institute issues a certificate, conferring use of the mark.

6. Apply for Recertification (every two years under version 3).

–Work with assessor and supply chain to gather any new data.

–Assessor evaluates data and progress on optimization strategies; evidence of progress is required for re-certification. The progress is context specific.

The Cradle to Cradle Certified Product Standard provides a continuous improvement pathway toward the development of safe and recyclable products. Product certification is available at five different levels (BasicBronzeSilverGold, and Platinum), with each higher level addressing a more rigorous set of requirements.

The Basic certification level is a “provisional” level designed to help companies “get on the path” toward the development of safe and sustainable products, recognizing the difficulty of transition and honoring human intention as an important part of any successful protocol for continuous product improvement. Certification at the Basic level requires a commitment to future assessment of the chemical ingredients in a product, and optimization of the product by phasing out harmful substances, implementing reutilization strategies, increasing the use of renewable energy, and implementing water stewardship and social fairness programs.

Up to this date, 205 companies have participated in the program and currently there are 306 active certificates representing an estimated 2,139 product variations. We have witnessed some amazing product breakthroughs occur through the certification process. After Puma’s 2010 Environmental Profit and Loss Account linked 57 percent of its impact with the production of raw materials (leather, cotton, and rubber, included), the brand turned to “clever raw materials” such as biodegradable polymers, recycled polyester, and organic cotton. Puma’s Incycleline was released in 2013, and a Cradle to Cradle Certified fashion product line represented a first in the fashion industry. In addition to improving the sourcing of their raw materials, Puma also improved the material health of these products through pigment positive lists and instituted an in-store take-back program to claim used Puma-ware for industrial composting and upcycle.

The Cradle to Cradle Certified approach is spreading worldwide. The Alcoa Foundation recently awarded a grant to the Institute to develop a new web-based education program that focuses on sustainable practices and designs for product designers. Following the course, participants have the opportunity to get their product certified and recognized as part of the Innovation Challenge. Learn more about this program here.

With the expansion of sustainability initiatives through company innovation and product development, we can build the new economy – one where products have a positive impact on people and planet.

Bridgett Luther is president at the Cradle to Cradle Products Innovation Institute.

Reference: environmentalleader.com
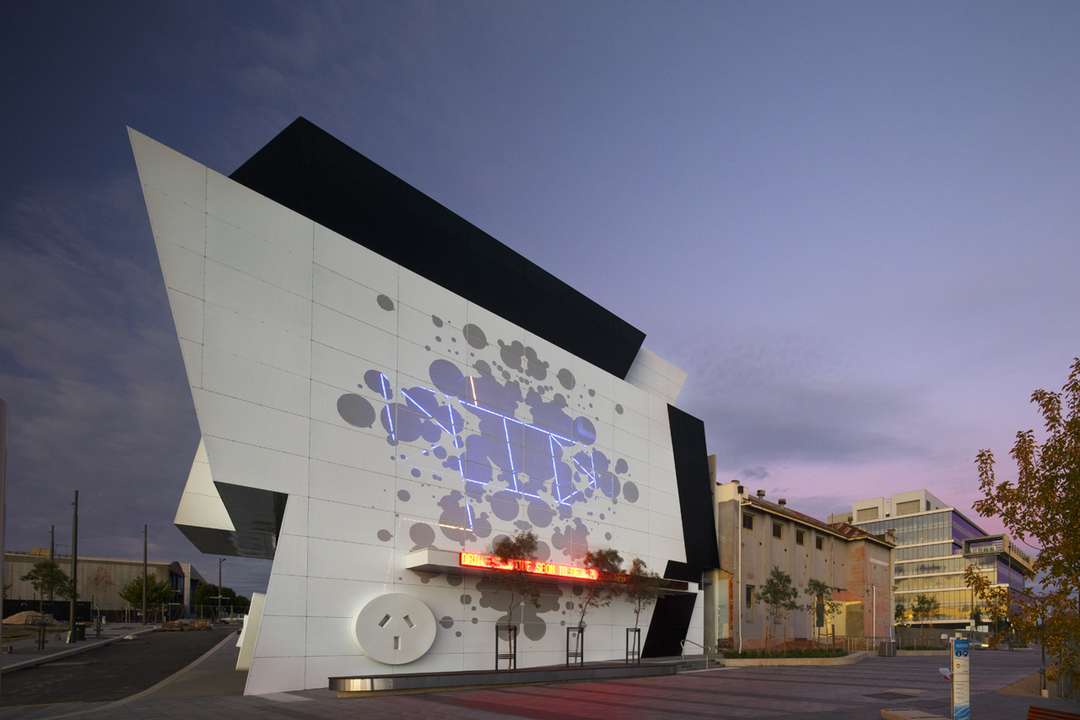
This Building’s Facade Literally Maps Out a Sustainable Future

If all buildings lit up with signs and indicators of how much energy is being consumed and where that energy is going, we’d all be a little more sensitive to our power usage. No one wants to broadcast how wasteful they’re being, right?

Perhaps energy-shaming isn’t the answer but it is something to delve deeper into and address — at least some of the guesswork would be taken out of environmental impact — as the conversations around terms and phrases such as “sustainable,” “eco-friendly,” “green,” and “environmental footprint” multiply year after year. Although these terms mean many things to different people, and we have yet to specify a universal definition for them, we can still use the concepts as tools for discussing the greater vision of using more than we produce.


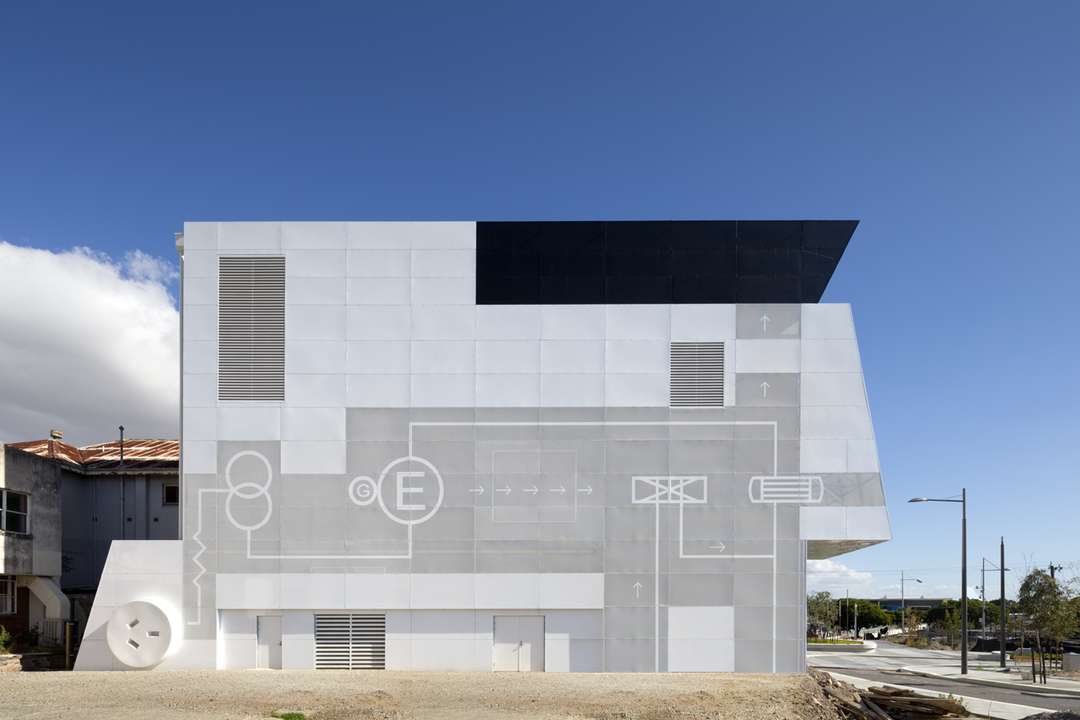
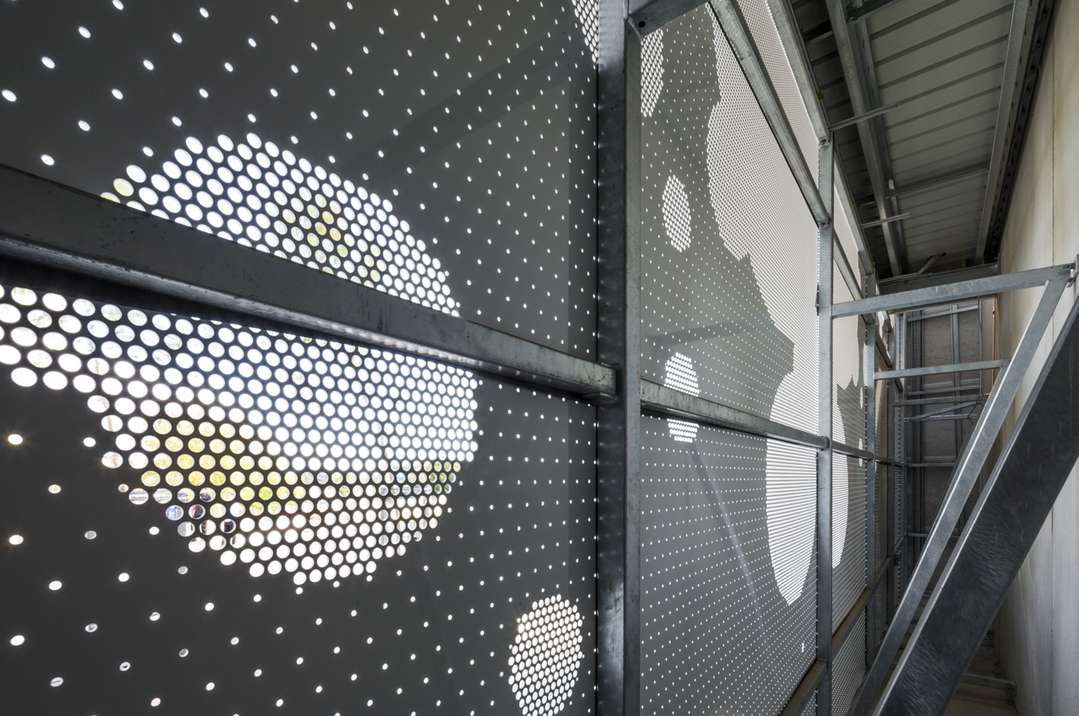
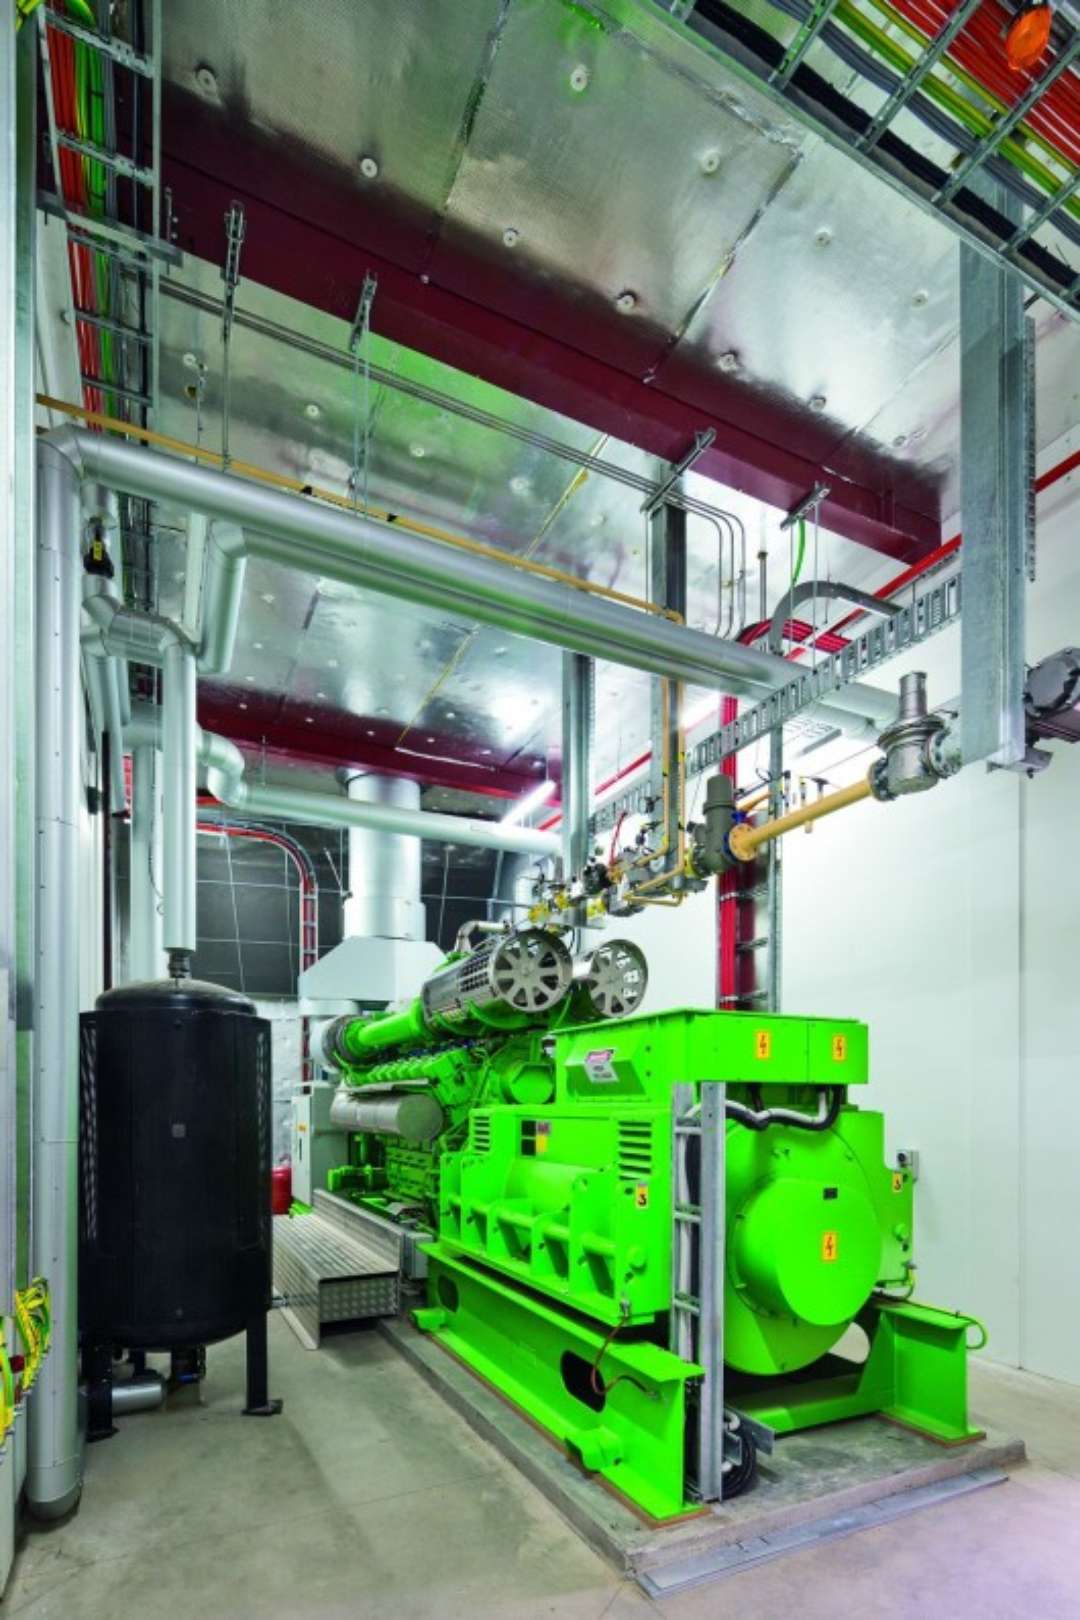
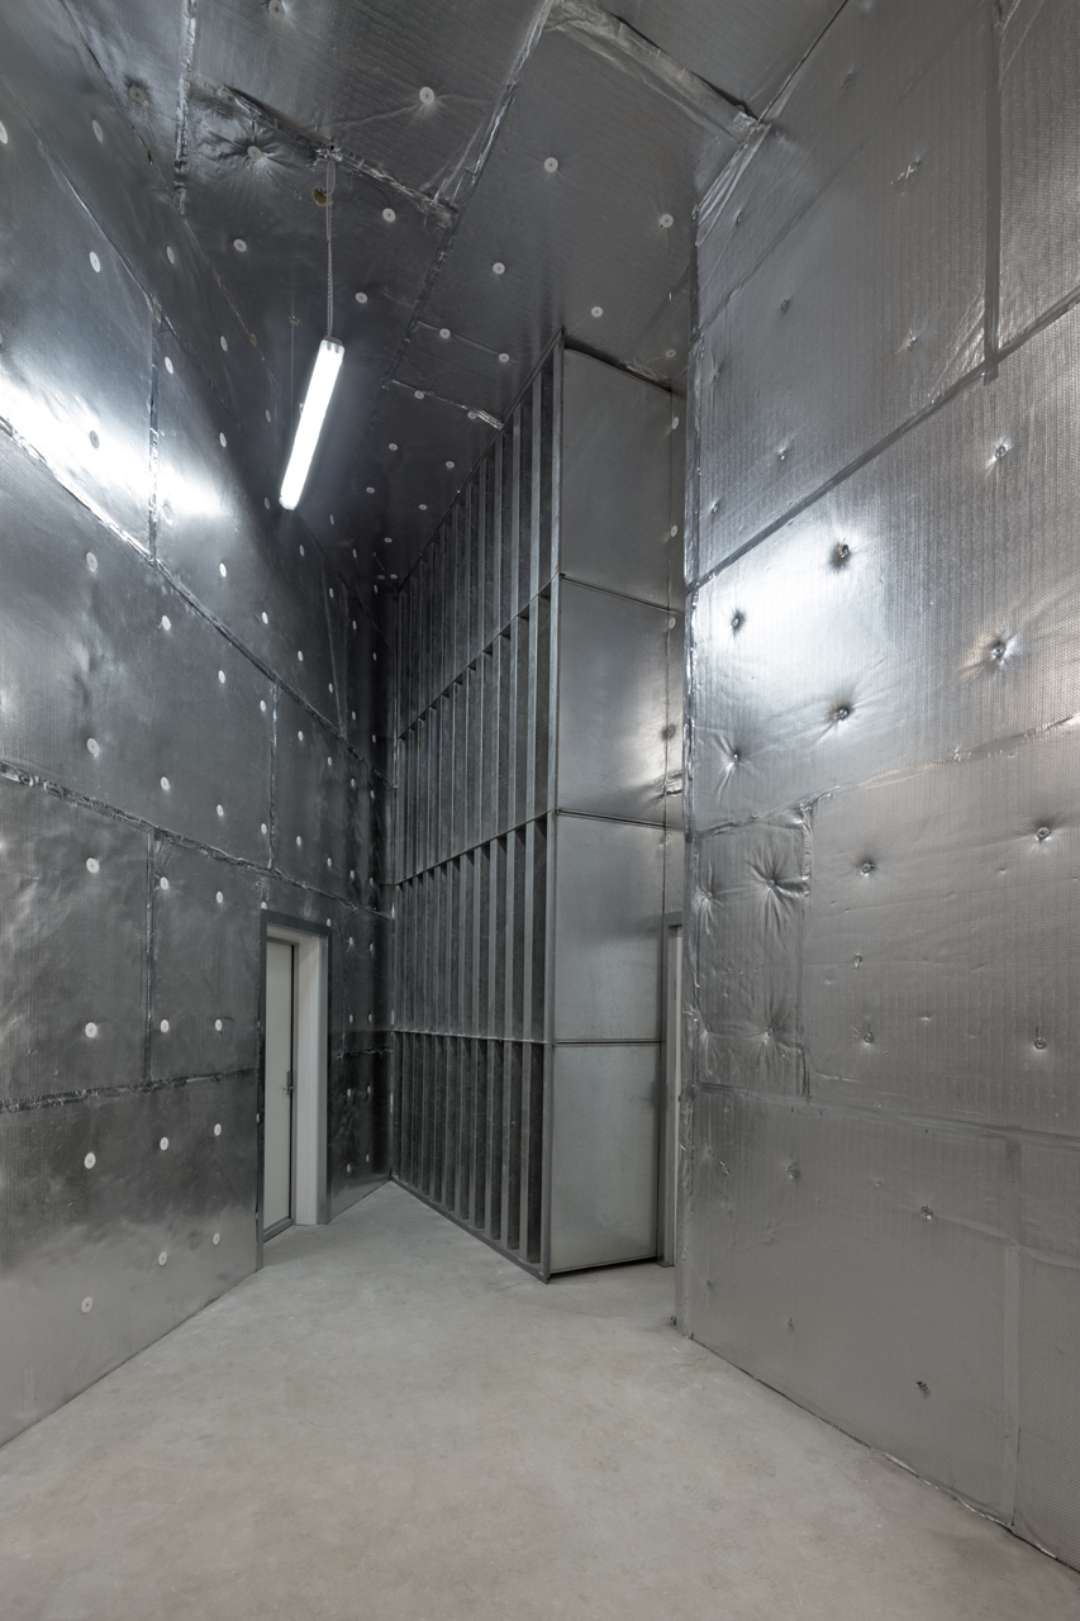
Take a look at Peter Hogg + Toby Reed Architects’ design for the Dandenong Precinct Energy Project (P.E.P.) in Australia. The P.E.P. produces electricity and heating thermal energy to surrounding buildings in the form of hot water. This supplies both high-efficiency energy for heating and cooling, as well as low carbon emissions. However, the remarkable aspect about this project is the fact that it provides the community with valuable information via the structure’s façade: a dot matrix on the front displays information about power production, consumption, and the building’s greenhouse gas savings; the rear has engineer schemes for the internal machinery; a large light switch and power socket, circuit diagram, as well as a cogeneration diagram all decorate the exterior walls.


At first glance, all of this data doesn’t exactly make sense. But, the guessing game you play with the structure (there’s even a Rorschach splatter image!) helps to facilitate public curiosity and knowledge. Even the most nonchalant of passersby will be curious and this inquisitiveness nods toward the general confusion surrounding energy production and consumption as a whole.


Image via ArchDaily, photo by John Gollings


Though the sculptural, ready-made quality of the building is straightforward enough to give pause for inquiry and education, what if buildings in heavily trafficked, public nodes of the future did more to engage and blatantly spell out what we’re doing to our environment. What if all (or even just commercial) buildings indicated on their façades the amount/type of energy they are producing and consuming? Maybe then, building-owners everywhere would take responsibility for their environment and examine the waste they’re producing — the publicly revealed numbers just may inspire a call to action. Or, possibly, that’s just wishful thinking.

Source: http://architizer.com/

Quick Reads on LEED

1. Challenges Seeking LEED Status in Older Buildings

Pursuing certification through the Leadership in Energy and Environmental Design (LEED) rating system can create major challenges for maintenance and engineering managers. The task is even greater when the institutional and commercial facilities date back to the days of Thomas Jefferson.

“It certainly presents a challenge for us to access the HVAC and lighting systems to repair and replace them without causing any further damage to the building,” says Ryan Taylor, zone maintenance superintendent for central grounds at the University of Virginia in Charlottesville, whose responsibilities include many of the original buildings designed by Jefferson. “We have to work closely with our historic preservation team to make sure we’re following the appropriate procedures and using proper materials for the repairs. We work closely with them to identify major problems that we need to focus on and make sure we’re taking the right steps to prepare them properly so those buildings can be preserved.”

The university has 23 LEED-certified buildings — including one building at the platinum, four at the gold, and 12 at the silver levels — and infuses sustainability and LEED into its capital development process, from pre-planning to post-occupancy. The maintenance department plays a central role in the LEED-certification process from the development stage.

“On the maintenance side, we are involved in the design review process and work with the architects and engineers to make sure the systems being installed are maintenance-friendly,” Taylor says. “It’s a combination of looking at LEED and looking at maintenance-friendly systems that we can continue to maintain once the building is constructed or renovated.”

2.  Is LEED Broken?

Today’s tip of the day is about what we can learn from LEED’s critics.

Oftentimes, the natural response to criticism is to get defensive, dig in your heels, and then counterattack. But that is usually less productive and more polarizing. To avoid such a reaction and instead open a dialogue is the key finding common ground and moving forward.

With that in mind, one of the more fascinating sessions at Greenbuild 2013 was titled “What We Can Learn From LEED’s Critics.” The session, presented by Tristan Roberts of BuildingGreen, Rob Watson of ECON Group (and who carries the “Father of LEED” moniker), and Pamela Lippe of E4 Inc., broke LEED criticisms into three main categories, and then examined the validity of each, and how USGBC has responded.

The first criticism is that the LEED process is broken — this covered both the rating system development process, as well as the certification process. To address the first, USGBC says it has maintained an open, iterative process to the rating system development process, as evidenced by the more than 20,000 public comments over six comment periods, and then the 86 percent approval when LEED v4 was put to a vote. They‘ve also drastically cut down on the time between submission and certification — 85 percent of projects are ruled on within 25 days of submission. That’s a vast improvement.

The second criticism is that LEED is not vigorous enough. You hear this one a lot from the vocal critics who say a LEED certified building isn’t any better than a traditional. USGBC is working diligently to compile more LEED data — now requiring all LEED registered projects to submit five years of water and energy data — to show that LEED buildings are, indeed, more environmentally responsible than traditional. During this discussion, Rob Watson unleashed the quote of the conference: “If your building isn’t performing, it’s your fault. Not LEED’s.” How true.

The third criticism is that LEED is too complex and too expensive. You commonly hear this from folks who think LEED certification is simply “buying a plaque” and that the constant updates to LEED make it impossible to keep up. No one would deny that LEEDv4 is a giant step forward in terms of rigor, but that’s what is needed to move the market, says USGBC. And as for “buying a plaque,” reasonable minds can disagree on the value of certification itself, but USGBC has always said that a third-party review is what really motivates projects teams to stay the course and follow through.

3.  LEED Dynamic Plaque May Lead To Better LEED Performance

Today’s tip of the day is about the performance of LEED certified buildings, and the new LEED Dynamic Plaque.

One of the hallmarks of a high-performance building is one that performs, highly. If that sounds to you like some sort of Jedi Mind Trick of circular reasoning, you’re not totally wrong. But there’s still much to unpack there — especially when you consider the long-standing snipe about supposedly high-performance, LEED-certified buildings that they were more about the checklist, and less about the actual performance.

Last year, at Greenbuild, concurrent with its roll-out of the new LEEDv4 system, which emphasizes performance and human health, U.S. Green Building Council also re-introduced its new vision for how buildings will be scored and monitored in the future: the LEED Dynamic Plaque. (Video of USGBC’s Scot Horst’s presentation is here.)

The LEED Dynamic Plaque — the concept was first introduced at Greenbuild 2012, but now, there is actually a real, live plaque being piloted in USGBC’s own Platinum space — gives users a real-time display of how the building is doing in the areas of water, waste, energy, transportation, and human experience. So now longer will LEED be a set-it-and-forget-it proposition – every user of the building from Day 1 forward will be able to see how the building is performing. And therefore, everyone will know whether or not it truly is a high-performance building as a LEED certification seemingly promises.

While transparency of data for all seems like a great idea in theory, the idea of the LEED Dynamic Plaque may make more than a few facility managers nervous. What if the building isn’t actually performing as intended? Who gets the blame?

But progressive facility managers see any data as an opportunity, especially when that data specifically shows opportunity. The LEED Dynamic Plaque will show occupants and upper managers alike — far outside the confines of a budget-request power point or an energy data spreadsheet — that the organization has a building it can be proud of.

4.  What Is High-Performance Building?

Today’s tip of the day is about the meaning of the term “high-performance building.” “High-performance” is actually a much more encompassing, and frankly, more accurate, term than “green” when it comes to describing the buildings facility managers own, manage, and maintain. But what does “high-performance” actually mean? Does it mean LEED-certified buildings that are energy and water efficient? Facilities that are people-friendly and get high marks from occupants for creature comforts? Highly automated, integrated buildings that turn big data into big efficiency gains with smart analytics? The answer, of course, is yes. A high-performance building is all of those things and more. The key to a high-performance building is optimization and integration of all things — whether fan speeds or fire safety, whether landscaping or lighting efficiency. It means thinking on both a micro and macro level about how building systems interact, and how building occupants interact with those systems. Yes, “high-performance” does tend to have a bit more to it than the traditional definition of green (a building that is environmentally responsible). Thinking about making a building “high-performance” means considering aspects of the building— fire/life-safety, ADA compliance, communication plans, even art work or other occupant-focused “bonuses” — that were certainly also considered in a green building, but may not have been emphasized. “High-performance” is how those in the industry will think about and define successful buildings in the future.

Source: Facilitiesnet

10 Smart Building Myths Busted

Smart buildings are a no-brainer and more affordable than most building owners and investors realize.

Smart buildings have been proven to save energy, streamline facilities management and prevent expensive equipment failures. Yet, to many property owners and investors, the value of smart buildings remains a mystery. The fact is, in most buildings, we can demonstrate a strong business case for strategic investments in smart building systems and management technologies.

Not everyone is aware that the tremendous advantages of today’s affordable smart building management technologies easily justify the cost. The following are 10 myths about smart buildings, along with the facts:

Myth #10: Smart Building Technologies Are Expensive.

Myth Debunked: Smart building technology investments typically pay for themselves within one or two years by delivering energy savings and other operational efficiencies. One smart building management pilot program we worked on, for example, generated a positive return on investment within several months.

Myth #9: Smart Buildings are Only About Energy.

Myth Debunked: A smart building management system often can detect when a piece of equipment is close to failure and alert facilities personnel to fix the problem. Knowing the right time to repair or replace equipment extends machinery life, and reduces facility staff, operations and replacement costs. More dramatically, smart building management systems can prevent full-scale building system failures—potentially embarrassing to a Superbowl stadium host, but life-threatening in a hospital or laboratory.

Myth #8: Smart Buildings and Green Buildings are the Same Thing. Myth Debunked: Smart buildings maximize energy efficiency from building systems and ensure air quality, while a complete “green” sustainability program includes strategies beyond building automation systems. So, while “smart” and “green” features may overlap, they are not identical concepts. The Continental Automated Buildings Association (CABA) explains the difference in Bright Green Buildings: Convergence of Green and Intelligent Buildings, a comprehensive report authored with Frost and Sullivan.

Myth #7: Industrial Facilities or Laboratories Can’t Become Smart Buildings.

Myth Debunked:  All types of buildings—whether residential or commercial—can be built or retrofitted to become highly automated and smart. Even highly specialized facilities such as laboratories can be outfitted with smart building technologies.

Myth #6: Smart Buildings Can Only Be New Buildings.

Myth Debunked: Some of the smartest buildings in the world are not new at all, but have demonstrated the return on investment in smart technologies. The Empire State Building, for example, has exceeded projected energy savings for the second consecutive year following an extensive phased retrofit begun in 2009.

Myth #5: Smart Building Technologies are Not Interoperable.

Myth Debunked: In the past, building automation equipment and controls were designed as proprietary systems. However, affordable new technologies, such as wireless sensors, now make it possible to gather data from disparate systems produced by any manufacturer.

Myth #4: Smart Systems Don’t Make a Building More Attractive to Tenants.

Myth Debunked:  Anything that improves energy efficiency, reduces occupancy cost and improves productivity is valuable to tenants, as numerous studies and surveys attest. Tenants and their advisors increasingly expect smart building features such as zoned HVAC, sophisticated equipment maintenance alert systems, and advanced security systems. As reported in JLL’s October 2012 Global Sustainability Perspective, smart systems provide benefits for tenants—and tenants recognize the benefits.

Myth #3: Without a Municipal Smart Grid, a Building Can’t Really Be Smart.

Myth Debunked:  It’s true that smart buildings gain functionality when supported by advanced electrical grids installed by municipalities and their utility company partners. But even without a smart grid, owners and investors can draw a wide range of benefits from smart buildings and a smart building management system that can monitor entire property portfolios.

Myth #2: Smart Buildings Are Complicated to Operate.

Myth Debunked: Combined with a smart building management system, a smart building is often easier to operate and maintain than a building that lacks automated systems. A smart building management system can integrate work-order management applications; pull equipment repair and maintenance data into performance analytics; and pinpoint equipment issues to a degree not humanly possible. For example, a smart building management system can diagnose a programming problem that has been undetected for 15 years, enabling facility managers to resolve a recurring equipment malfunction.

Myth #1: Smart Buildings Are a No-Brainer.

Myth NOT Debunked: This myth isn’t a myth at all — it’s actually true. As affordable new technologies are adopted, tenants are beginning to expect smart building features—and owners and investors are beginning to realize the return on investment in smart systems.

Leo O’Loughlin is senior vice president of Energy and Sustainability Services at JLL, the global professional services and investment management firm offering specialized services to clients that own, occupy and invest in commercial real estate. With 20 years of energy and sustainability management expertise, Leo helps clients incorporate energy and sustainability concepts into operations and project management, reducing energy consumption, utility expense and carbon emissions. He specializes in creating and analyzing project structures for energy efficiency, central utility plant and energy services outsourcing programs, managing the multi-disciplinary development of energy infrastructure assets and retrofit projects. He also manages business development, commercial structuring, financial and technical analyses and implementation of energy-related projects. Previously, Leo was an executive at several leading California energy companies. He holds an MBA from San Diego State University and a BS in mechanical engineering from Purdue University. 

Source: http://www.energymanagertoday.com/10-smart-building-myths-busted-0100847/

BUILDING AUTOMATION AND MANAGING THE CORPORATE FACILITY

Today’s facility and IT managers are facing multiple challenges in managing corporate facilities. The corporate facility includes various areas such as the commercial building, manufacturing floor, warehouse, remote sites, and data center. All of these corporate facilities require different attention from the managers to meet the corporate sustainability goals set forth by the executive team. Goals that mainly revolve around reducing CapEx and OpEx costs by performing energy reduction, capacity planning, equipment life-cycle-management, and provide a productive and collaborative work environment that the manager has to deal with on a continuous basis.

These top-of-mind issues require accurate data collection, and are converted into useable information to enable smart decision-making. At the same time, the manager is asked to perform all of his or her daily activities with less staff to reduce overhead cost. This “do more with less” phenomena requires the manager to utilize the latest Information Technology to gain insights into areas that need improvement through the use of Building Automation Systems and benchmarking against industry metrics. A good Building Automation System empowers organizations to reduce operational and capital expenses, improve visibility of key operational data, and enable sustainable, energy efficient facilities.

Building Automation System describes the system of controls that has the advanced functionality to monitor, manage and control building equipment.  Types of equipment include water, gas, electricity metering, heating, ventilation, air conditioning equipment, lighting, surveillance, access control, digital signage, and fire life safety monitoring. In most cases, each system operates in silo with little or no communication to each other. Each of the systems gathers data individually and stores the data with its own format, thus requires the facility manager to compile all the data manually from several locations to gain visibility to the condition and usage of the facility. This introduces many problems with facility management in wasted resource and time, questionable accuracy of energy accounting, and inconsistency in the reporting metrics.

Source:

School District Reduces Energy Use, Saves $160,000

The Fort LeBoeuf School District in northwest Pennsylvania is saving more than $160,000 annually after having SmartEdge complete a multi-phase facility enhancement program.

The first phase of the plan, implemented at a cost of $1.3 million, focused on four of the district’s five school buildings. SmartEdge completed upgrades to interior and exterior lighting, installed new heating, ventilation and air conditioning (HVAC) system controls, optimized boiler plant operations, retro-commissioned major HVAC equipment, rebalanced air flows and installed a new high efficiency chiller.

The second phase of SmartEdge’s plan focused on the Robison Elementary facility and improved energy efficiency as well as safety and security systems. The $3.3 million enhancements included upgrades to interior and exterior lighting, installation of a new HVAC system and associated direct digital controls, installation of new windows, upgrades to fire and security systems, and installation of a new district-wide telephone system.

The first phase of the program, completed in December 2012, has reduced annual electrical consumption by more than 965,000 kWh, about 30 percent, and annual gas consumption by over 37,000 centum cubic-feet (ccf), or 24 percent. Based on current energy costs, the reduced consumption lowers annual utility bills by $110,000 while operations and maintenance cost savings are an additional $19,000 annually.

The work at Robison Elementary will generate energy savings of 166,000 kWh of electricity and almost 8,000 ccf of natural gas. This will provide an additional utility cost savings of $22,000 and savings of $12,000 in operations and maintenance.

The improvements at Robison Elementary enabled the school to increase its EnergyStar rating from 84 to 99. Other district schools saw similar gains. The high school improved to 72 from 21, the middle school to 84 from 54, while one elementary school saw its EnergyStar rating rise from 36 to 81 and the other went from 12 all the way to 84.

Source: Energy Manager Today

Deferred Capital Renewal Can Be Used To Justify HVAC Upgrades

Facility managers should determine if deferred capital renewal should be part of the analysis to justify large energy upgrades.

An example of a deferred capital savings is the evaluation of installing a new boiler as compared to maintaining the existing boiler. A 20,000 pound per hour (pph) boiler with mud and steam drums (the heart of the boiler) may be in good condition, but the boiler tubes could be thinning and need to be replaced. The cost to retube and recase this boiler is approximately $350,000. In this example, the recasing and retubing of the boiler will not increase the boiler efficiency of the system. Also, the existing boiler is assumed to have an efficiency of 75 percent.

A newer boiler with stack economizer could have an efficiency of 85 percent and the cost to install this boiler is approximately $1.2 million. In 2012, the average national cost for natural gas was approximately $8.15 per thousand cubic feet or approximately $8.00 per million BTU. Assuming the boiler operates at full load for 2,500 hours, the increase in efficiency would save the facility approximately $62,000 per year in natural gas costs. The simple payback to replace the boiler without the deferred capital is 19.4 years (capital cost of $1.2 million and an annual savings of $62,000 per year). However, if the analysis took into account the $350,000 cost to recase and retube the boiler, this would reduce the capital cost from $1.2 million to $850,000 and the corresponding simple payback would be reduced to 13.7 years. The cost to recase and retube the boiler should be included in the analysis because this work needs to be completed to maintain the operation of the system.

Another example is the replacement of a 30-year-old water chiller. Typically, chillers installed at this time were constant speed units. Based upon ASHRAE numbers, the average service life of a water-cooled chiller is 23 years. That does not mean that, once a chiller has been in service for 23 years, the unit will fail, but rather that a plan for the chiller replacement should be in place based on that average service life. A 450-ton constant speed water-cooled chiller has been designed to have a chiller efficiency of 0.70 kW/ton, but because of the age of the equipment the chiller could be de-rated to an efficiency of 0.81 kW/ton, assuming a 0.5 percent per year degradation. A variable flow chiller unit can be selected to operate with an efficiency of 0.50 kW/ton. Based upon the unit operating at full load condition for 1,500 hours and an electric rate of $0.08/kWh, the annual savings for installing the VFD unit is approximately $16,700 per year.

The cost for the new VFD chiller system is estimated to be $250,000. This would correspond to a simple payback of close to 15 years. If the analysis included the cost to replace the unit with a constant speed chiller (assuming the cost of $203,000), the difference in capital costs is only $47,000 and the simple payback would be reduced to 2.8 years. Even if the analysis assumed that the constant speed chiller was installed with the original efficiency (0.70 kW/ton) the simple payback is still 4.3 years.

It is difficult to identify the deferred capital savings in terms of simple payback when evaluating equipment that still has useful remaining life. The cost to replace the equipment cannot be simply subtracted from the cost of the energy conservation measure. However, a complete life cycle cost analysis can be completed to identify the most economical approach.

Andy Jones, PE, is mechanical engineer/project manager at RMF Engineering. He can be reached at andy.jones@rmf.com.

Maintenance Savings May Help Justify HVAC Capital Investments

Once a bundle of projects has been identified, facility managers should also determine whether a reduction in maintenance expenses can legitimately be anticipated. Facility managers should determine if deferred capital renewal should be part of the analysis to justify large energy upgrades.

An example of additional maintenance savings that will lower the simple payback is a lighting project that changes out incandescent bulbs to CFL or LED bulbs. The typical lifespan of an incandescent light is approximately 1,200 hours, while a CFL has a life span of 8,000 to 10,000 hours and a LED light has a life span of 20,000 to 50,000 hours. The cost of the material and the time for repeatedly replacing the bulbs should be included in the analysis to identify the entire savings for the energy conservation measure.

Another maintenance savings example is replacing building pneumatic controls with a direct digital control (DDC) system. Pneumatic control systems use compressed air, which is typically generated by a compressor (or series of compressors, depending on the size of the system; some rare installations use nitrogen or other bottled gas). Typically the annual maintenance can be 40 man-hours for inspections and the scheduled monthly maintenance service required.

If this work is completed by a third party it is easily tracked and identified, but it is more difficult to identify the hours if this work is completed in house.

How Bundling Energy Efficiency Projects Helps Justify Large Capital Upgrades

A key step in justifying many large capital upgrades is to bundle them with other work that has a quick payback. There are a wide range of quick win strategies to bundle in with more complex endeavors. Low-cost or no-cost projects can be implemented by facility managers in conjunction with standard operations and maintenance procedures. For example, the facility manager can ensure that the outside air dampers for the air handling units are operational during peak cooling and heating conditions. If the dampers are not functioning properly and remain fully open during the winter months, the result would be an increase in energy use. The HVAC system would be trying to maintain the heating set point based on a lower mixed air temperature, due to the increased amount of colder outdoor air added to the warmer return air. If the dampers are functioning properly, the temperature rise would be much less and require significantly less energy.

Revisiting the applicable ventilation air requirements is another easy way to save energy. If a space previously used as a lab or a classroom is now an office, the amount of required outdoor air changes, i.e., the damper set points, could be altered. Also, changes made in space use often do not include HVAC system rebalancing. A space is often repurposed without any modifications to the HVAC system.

In a bundling strategy, the next step up from no- or very low-cost energy efficiency measures involves relatively small projects that may require an engineering design or additional evaluation. One example is the installation of variable frequency drives on motors. For example, a 20 horsepower pump operating 24 hours per day for a quarter of the year (91 days) with $0.08/kWh electrical cost will incur an electrical charge of $2,890 per year, assuming a motor efficiency of 90 percent.

The installation of a variable frequency drive will allow the pump to operate at decreased flow and pressure throughout the year. The flow will decrease at the same rate the motor speed decreases. The energy costs decrease as the cube of the flow (motor speed) decreases. If the installation of the variable frequency drive reduces the flow by 25 percent, then the resultant reduction in energy use is 58 percent. However, the reality is that approximately 50 percent energy savings will be obtained. The savings for this project is approximately $1,450 per year. Based upon RS Means, the average installed cost for a 20 horsepower pump is approximately $4,000 to $5,000 depending on location. The simple payback for this energy conservation measure is approximately 2.7 to 3.5 years.

All analyses of energy conservation project paybacks should of course be based on actual power rates paid by the facility. The impact on demand charges should also be considered.

Let’s Connect. Collaborate. And Partner Together! Let’s maximize your energy efficiency investments together: info@setpointsystems.com

Steps Beyond Simple Payback To Justify Large Energy Efficiency Investments

When top management relies solely on simple payback based on energy savings, it can be difficult to justify energy efficiency projects involving very large capital investments. Those projects may be uncovered by energy audits, which — with current state legislation and energy incentives — are becoming an increasingly popular means for identifying and implementing campus and building renewal projects. Energy audits help facility managers identify ways to reduce energy consumption by changing the operating schedule of HVAC or lighting devices. Audits can also help justify replacing inefficient, aging, or failing equipment within a building.

Simple payback calculation is sometimes used to determine if the change in schedule or replacement is required. The simple payback is typically calculated by dividing the annual energy savings for each project by the capital cost to replace or modify the piece of equipment. If there are any incentives or rebates, they are subtracted from the capital costs.

When top management relies solely on simple payback based on energy savings, it can be difficult to justify projects involving very large capital investments. The simple-payback approach does not present the whole picture of the value of the upgrade.

There are several ways to try to overcome the limitations of that approach. One is to bundle projects, so that work with very quick payback periods helps to balance upgrades with much longer paybacks. Another step to help show management the entire project value is to include other factors in the analysis, like maintenance savings and deferred capital (the cost to replace a unit in kind if the unit is beyond its useful life). These factors need to be calculated very carefully to ensure that they are realistic.

The importance of this broader approach can be seen from a project conducted under the Commonwealth of Massachusetts’ energy reduction program. The program aims to reduce energy consumption by 25 percent for all state-owned-and-operated facilities. The state used the simple payback method based only on energy savings (energy, rebates, and incentives) savings. The projects are expected to have a simple payback of 15 to 20 years or less to justify the investment.

A large state university evaluated under the program had identified a project with an energy savings of 21 percent and a simple payback of 19 years based upon energy consumption only. The university had to sell this project to its board and would have found it difficult with a simple payback of 19 years, but the university was also able to include the savings for deferred maintenance and deferred capital. The inclusion reduced the simple payback from 19 years to less than 9 years. (At the time of this writing, the contribution from utility company incentives and rebates for this campus was not included because a substantial amount of the design was not yet completed).

It’s important to note that there were more than 150 energy conservation measures identified in this project, with simple paybacks ranging from 6 months to more than 50 years. When all of these were considered under one umbrella, the overall project had a simple payback that was in the range of the total system requirement. Bundling helped to move forward projects with long payback periods; this is carefully programmed so that the overall project is still able to maintain an acceptable payback period.

Let’s Connect. Collaborate. And Partner Together! Let’s maximize your energy efficiency investments together: info@setpointsystems.com